133
Shares
WASH Rights Network
Enugu State Water Supply Tracking Platform
- 00Days
- 00Hours
- 00Minutes
- 00Sec
- 00Days
- 00Hours
- 00Minutes
- 00Sec
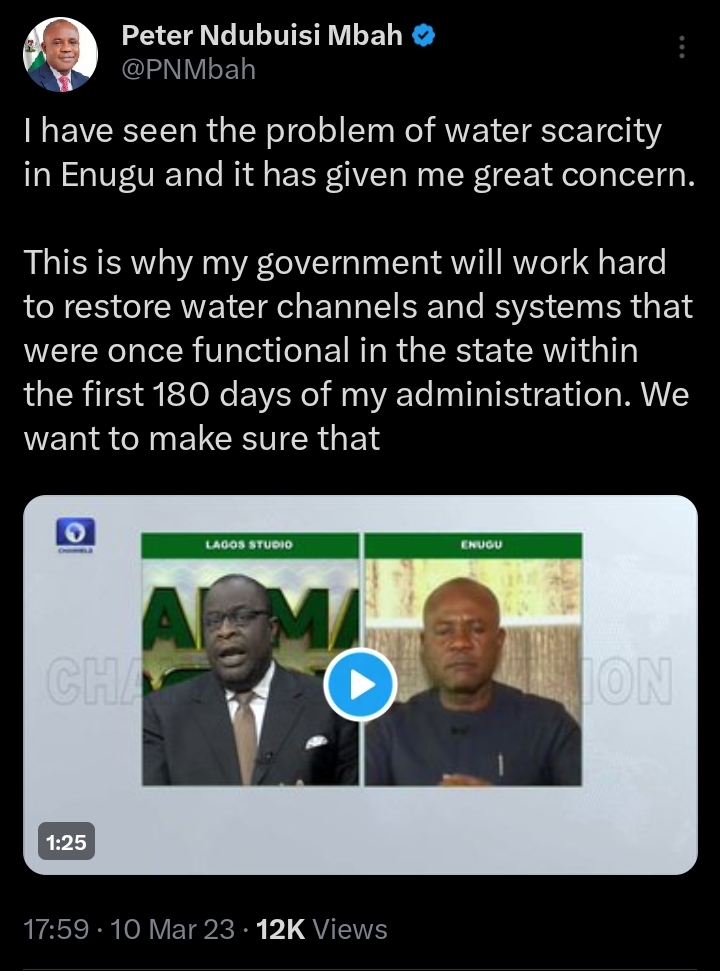
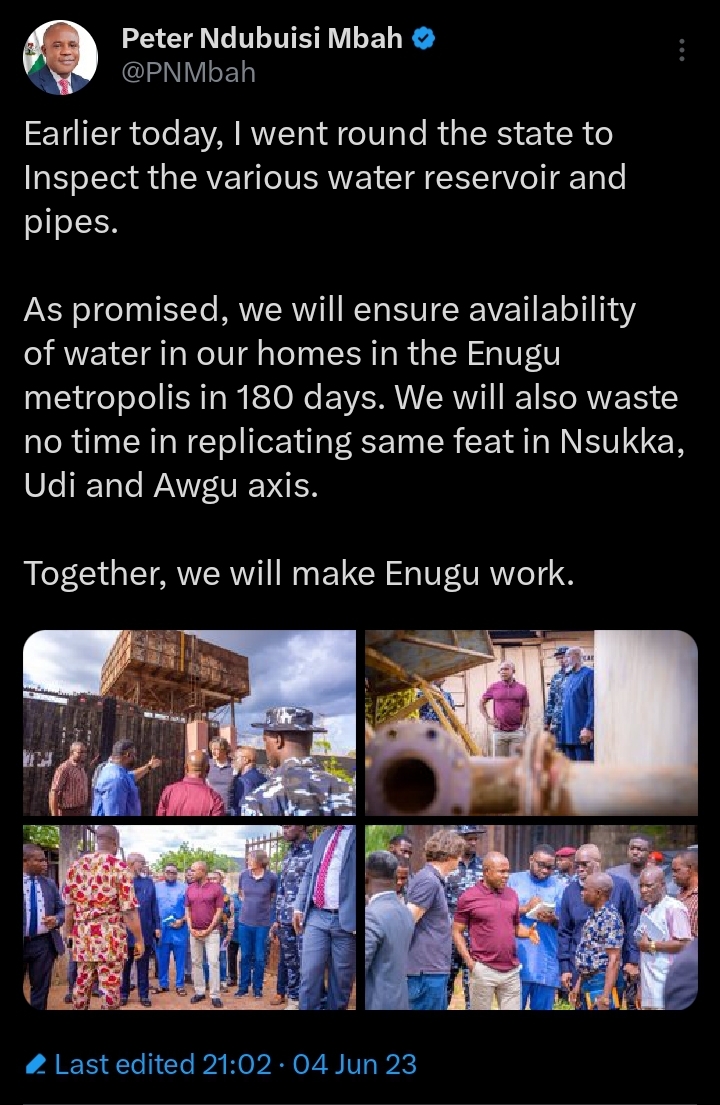
The Enugu State Government has committed to providing clean drinking water supply to the people of Enugu State within 180 days from the date of inauguration, which is from May 29 to November 29, 2023.


Background on Water Supply in Enugu State
#EnuguWaterScarcity is artificial and man-made, as the total combined design capacity of all the water supply schemes presently in the state is enough to meet the demands of residents of Enugu Metropolis.
Facts & Figures
The National Water Supply and Sanitation Policy (2000) established the standard for water
demand/consumption rates for individuals in urban, small towns and rural as follows:
| Category | Popuation | Water Demand (l/c/d) |
|---|---|---|
|
Rural Area |
Up to 5,000 |
30 |
|
Small Town |
5,000 to 20,000 |
60 |
|
Urban Area |
20,000 and above |
120 |
Based on established National standard for water consumption/demand of 120 l/c/d for urban area, the water demand for Enugu Metropolis and Nsukka (both classified as urban) are as shown in the table below.
| Town | Estimated Population | Desired demand m 3 /day | Installed Capacity m 3 /day | Present output m3/day |
|---|---|---|---|---|
|
Enugu |
1,093,095 |
131,171 |
131,500 |
26,113 |
|
Nsukka |
468,348 |
56,208 |
19,152 |
2,696 |
The data above shows that the entire Enugu Metropolis residents need 131,171 cubic meter of water per day which can be met by only 3 water schemes (Ajali, Oji and Iva Valley), with a combined installed capacity of 131,500 cubic meter per day, if they are working at full capacity.
Above data provided by Enugu State Water Corporation excludes the non-functional 9 th Mile Crash Programme Scheme with a capacity of 28,000m 3 /day. Also, the present outputs stated above are exclusive of about 50% water output losses.
Problem of Enugu State Water Supply is therefore not installed capacity, but mainly lack of capacity for maintenance of electromechanical equipment and inefficient operation of existing facilities.
Water Facilities status prior to 29th May 2023
Water Facilities status prior to 29th May 2023
| S/N | Name of Water Scheme | Design capacity (m 3 /day) | Capacity as at June 2019 | Capacity utilization % | |||
|---|---|---|---|---|---|---|---|
|
|
June, 2019 |
June, 2019 |
|||||
|
1 |
Ajali |
77,000 |
3,452 |
4.5 |
|||
|
2 |
Oji Augmentation |
50,000 |
5,945 |
12 |
|||
|
3 |
Iva head work |
4,500 |
1,336 |
30 |
|||
|
4 |
Nsukka Urban |
19,000 |
1,875 |
10 |
|||
|
5 |
Udi -Nvene |
1,200 |
112 |
9 |
|||
|
6 |
9th Crash program |
28,000 |
- |
|
|||
|
7 |
Old 9th Mile |
- |
- |
- |
|||
|
|
Total |
132,700 |
12,720 |
13 |
|||
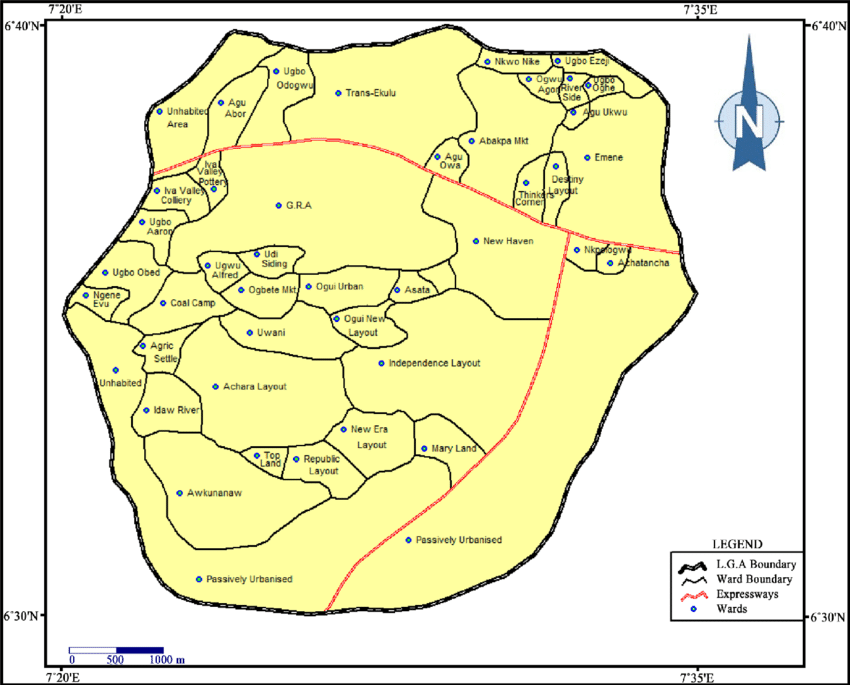
Live Map of major areas within Enugu metropolis
Updates & Feedback

WASH Rights Network
Democratizing Clean Water Access
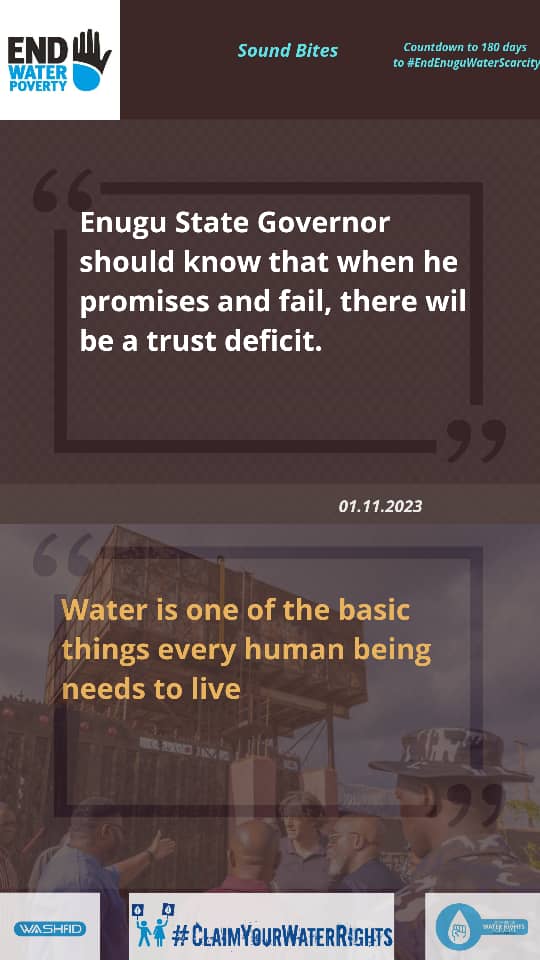
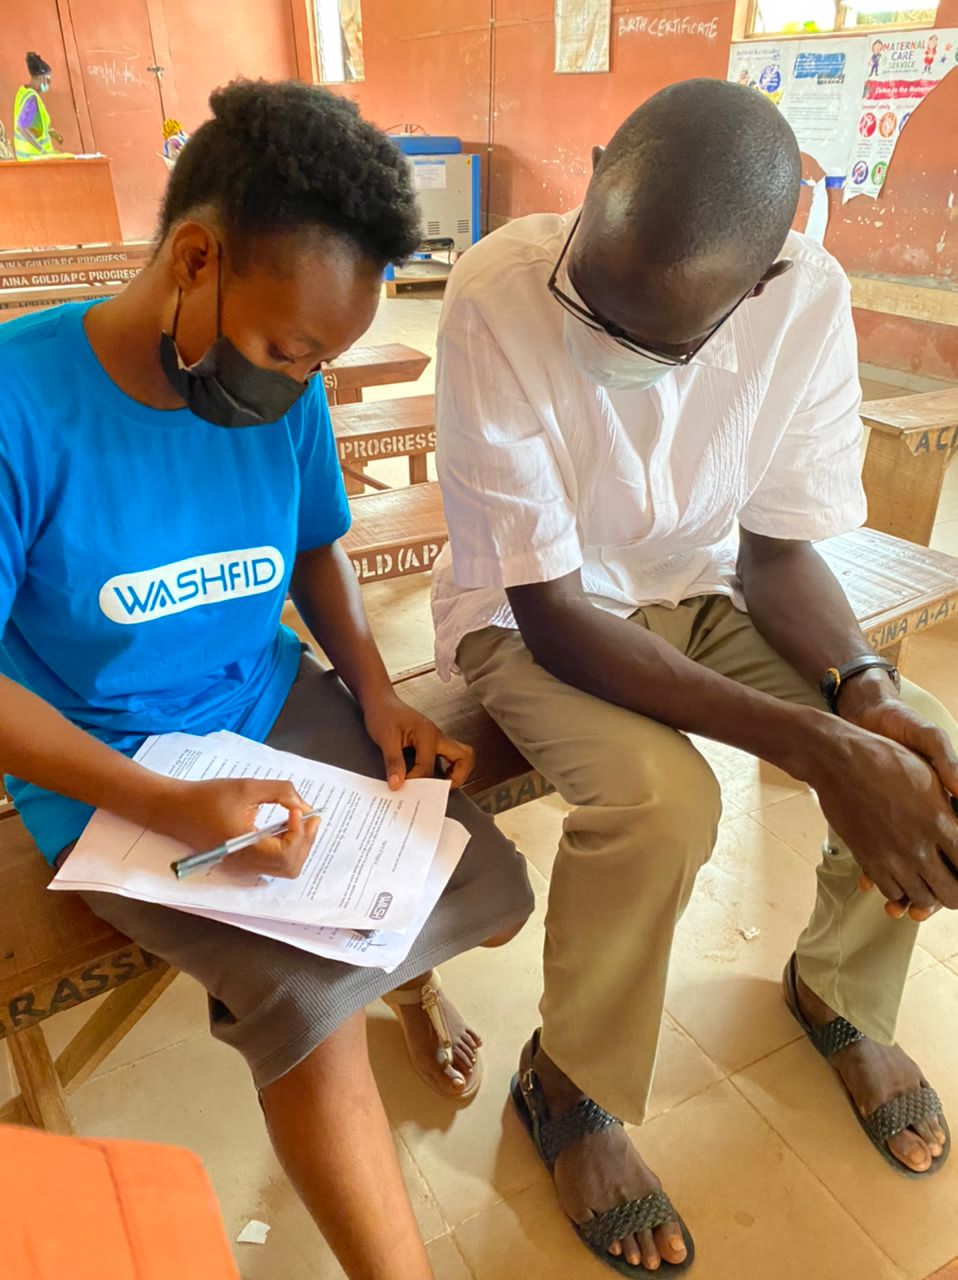
There is no gainsaying that a health centre without a sustainable source of water supply; clean, safe and inclusive toilet facilities for both patients and health workers; and handwashing facilities, is a death trap.
Lorem ipsum dolor sit amet, consectetur adipiscing elit. Ut elit tellus, luctus nec ullamcorper mattis, pulvinar dapibus leo.